Uncategorized
GIFM wishes you a Happy & Prosperous Deepavali !!!

4 Days Workshop on Option Arbitrage & Strategies

Using Open Interest To Find Bull/Bear Signals

Open interest is an indicator often used by traders to confirm trends and trend reversals for both the futures and options markets. Open interest represents the total number of open contracts on a security. Here we’ll take a look at the importance of the relationship between volume and open interest in confirming trends and their impending changes.
Volume and Open Interest
Used in conjunction with open interest, volume represents the total number of shares or contracts that have changed hands in a one-day trading session in the commodities or options market. The greater the amount of trading during a market session, the higher the trading volume. A new student to technical analysis can easily see that the volume represents a measure of intensity or pressure behind a price trend. The greater the volume, the more we can expect the existing trend to continue rather than reverse.
Technicians believe that volume precedes price, which means that the loss of either upside price pressure in an uptrend or downside pressure in a downtrend will show up in the volume figures before presenting itself as a reversal in trend on the bar chart. The rules that have been set in stone for both volume and open interest are combined because of their similarity; however, having said that, there are always exceptions to the rule.
General Rules for Volume and Open Interest
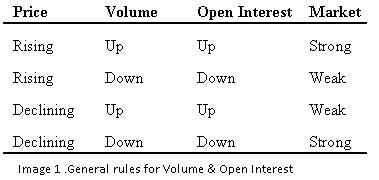
The chart below summarize the rules for volume and open interest.

So, price action increasing in an uptrend and open interest on the rise is interpreted as new money coming into the market (reflecting new buyers); this is considered bullish. Now, if the price action is rising and the open interest is on the decline, short sellers covering their positions are causing the rally. Money is therefore leaving the marketplace; this is a bearish sign.
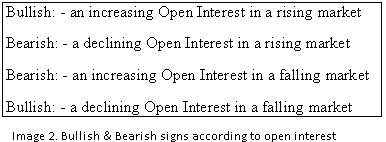
If prices are in a downtrend and open interest is on the rise, chartists know that new money is coming into the market, showing aggressive new short selling. This scenario will prove out a continuation of a downtrend and a bearish condition. Lastly, if the total open interest is falling off and prices are declining, the price decline is likely being caused by disgruntled long position holders being forced to liquidate their positions. Technicians view this scenario as a strong position technically because the downtrend will end once all the sellers have sold their positions. The following chart therefore emerges:

When open interest is high at a market top and the price falls off dramatically, this scenario should be considered bearish. In other terms, this means that all of the long position holders that bought near the top of the market are now in a loss position, and their panic to sell keeps the price action under pressure.
The Bottom Line
There is no need to study a chart for this indicator since the rules are the most important area to study and remember. If you are a new technician starting to understand the basic parameters of this study, look at many different charts of gold, silver and other commodities so you can begin to recognize the patterns that develop.